Sentiment analysis on streaming Twitter data using Kafka, Spark Structured Streaming & Python (Part 3)
Table of contents
Before jumping into this article, make sure you read the other parts of this project: Part 1 and Part 2.
Goal
The goal of this article is to visualise the sentiment analysis previously done.
Roadmap

As shown in the previous article related to this project, we stored the real-time data into MongoDB Atlas after doing sentiment analysis on them. During my research, I found that MongoDB Atlas has a visualization part and I decided to explore it.
Let's jump into it.
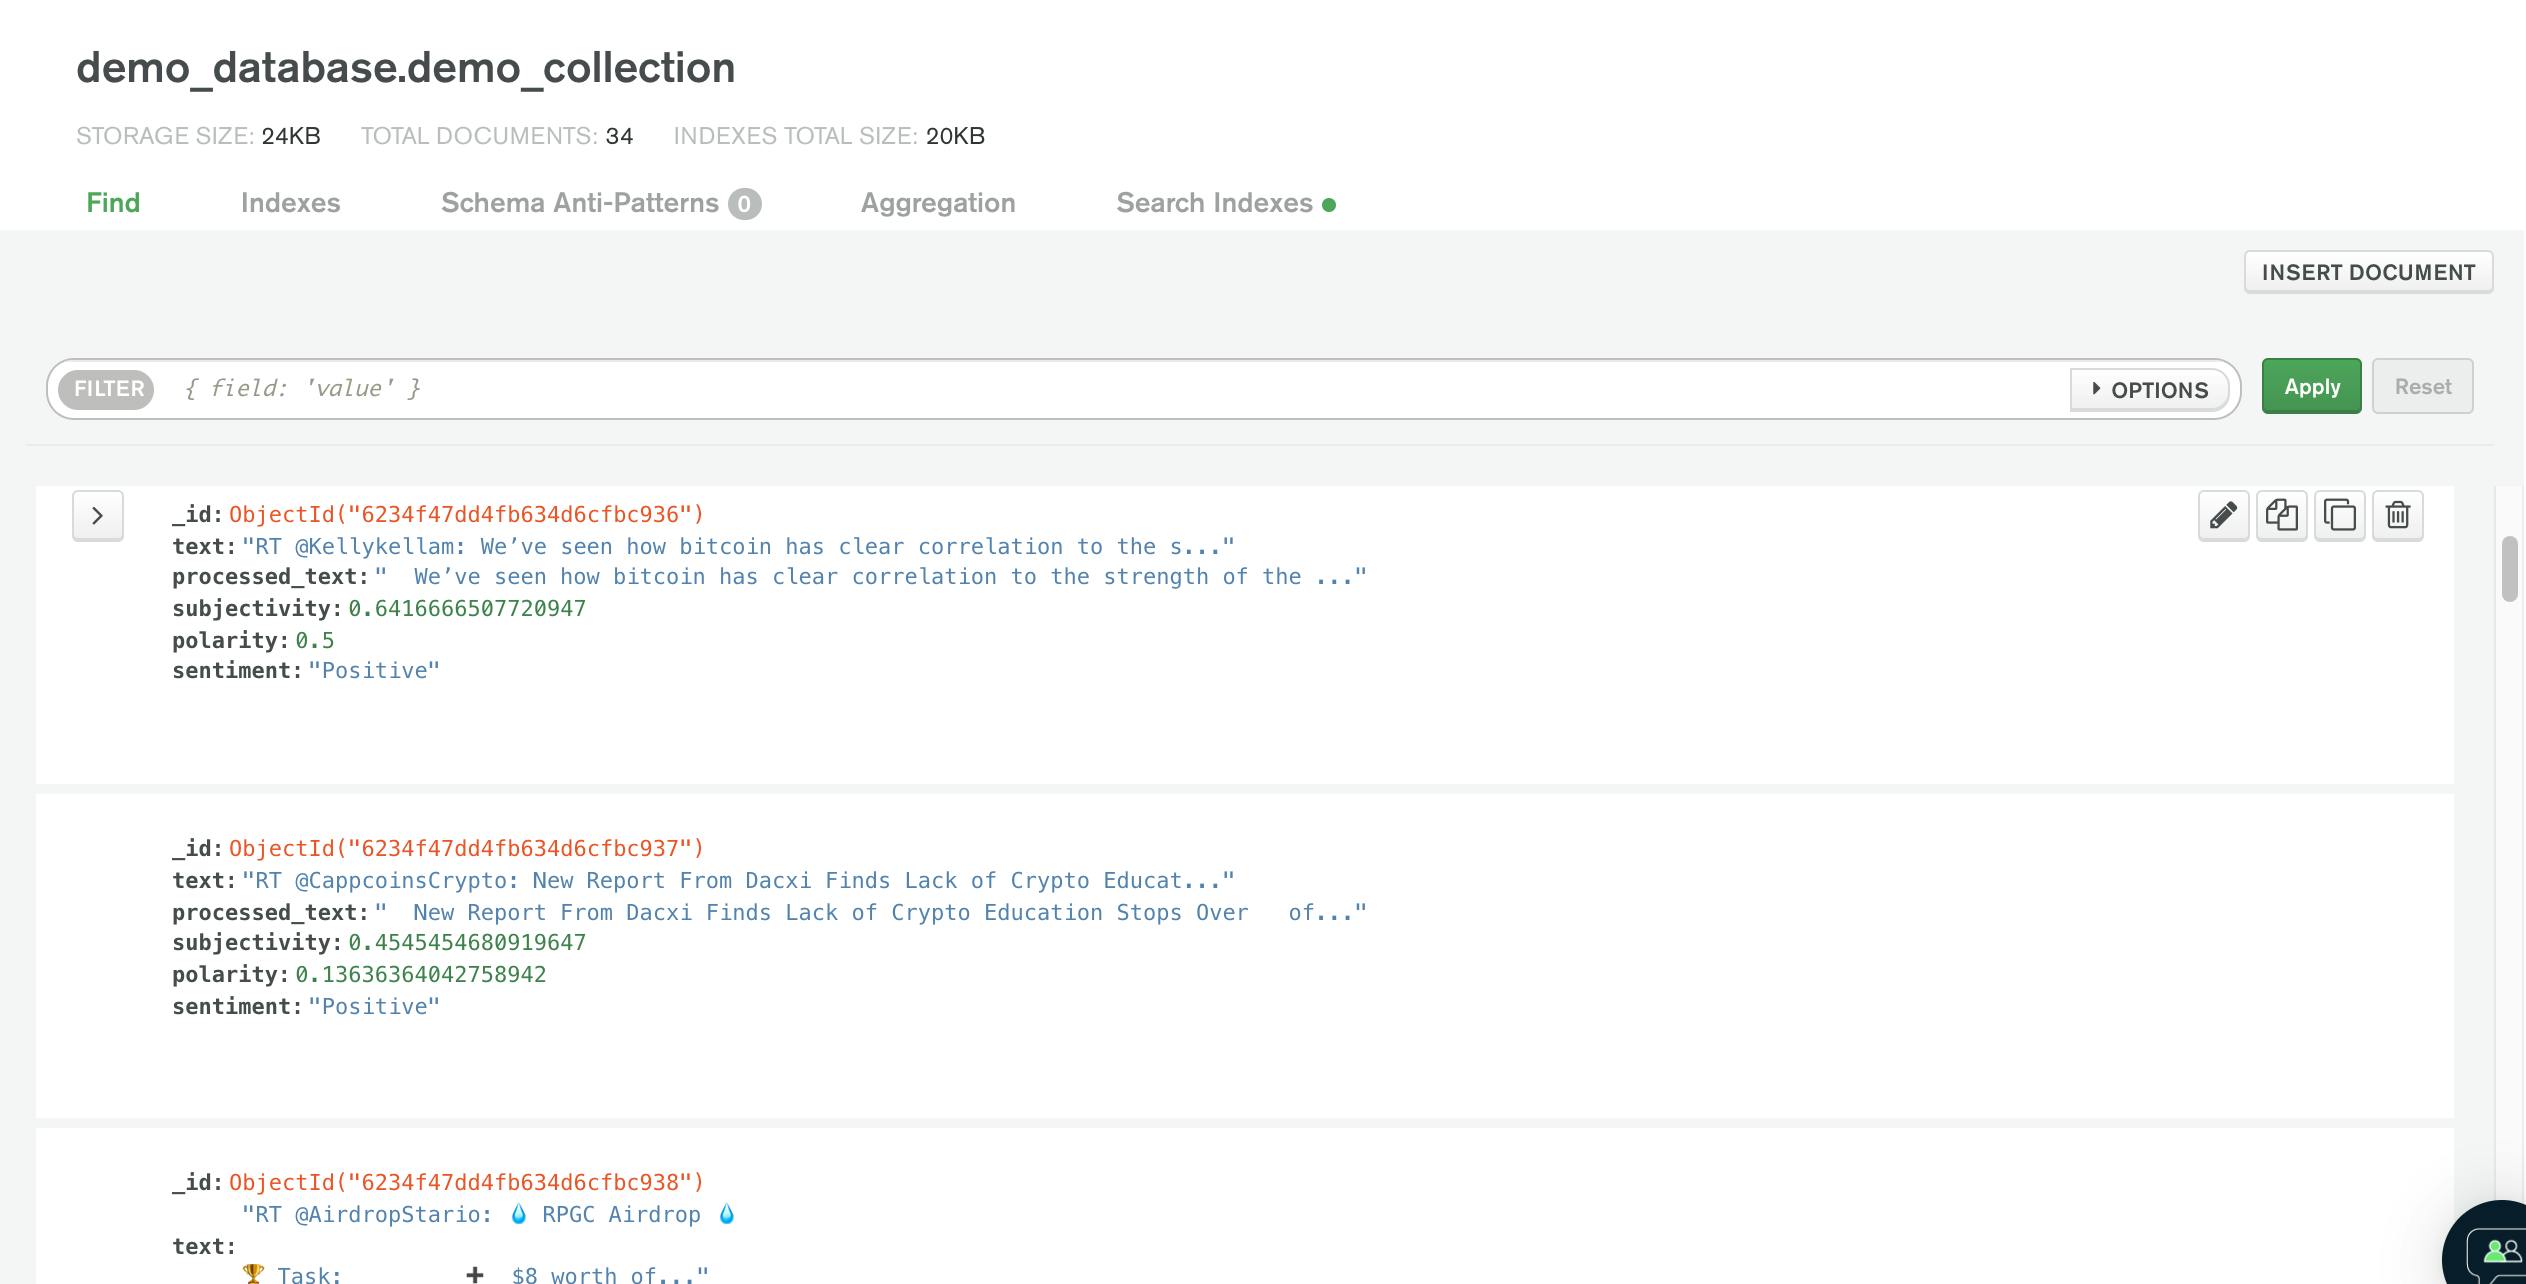
While ingesting the tweets using Kafka, and processing them using Spark Streaming, I store them into MongoDB Atlas. It is important to notice that, we choose as a search word in tweets the terms Bitcoin. We then get tweets in the database in this form and with the sentiment associated:

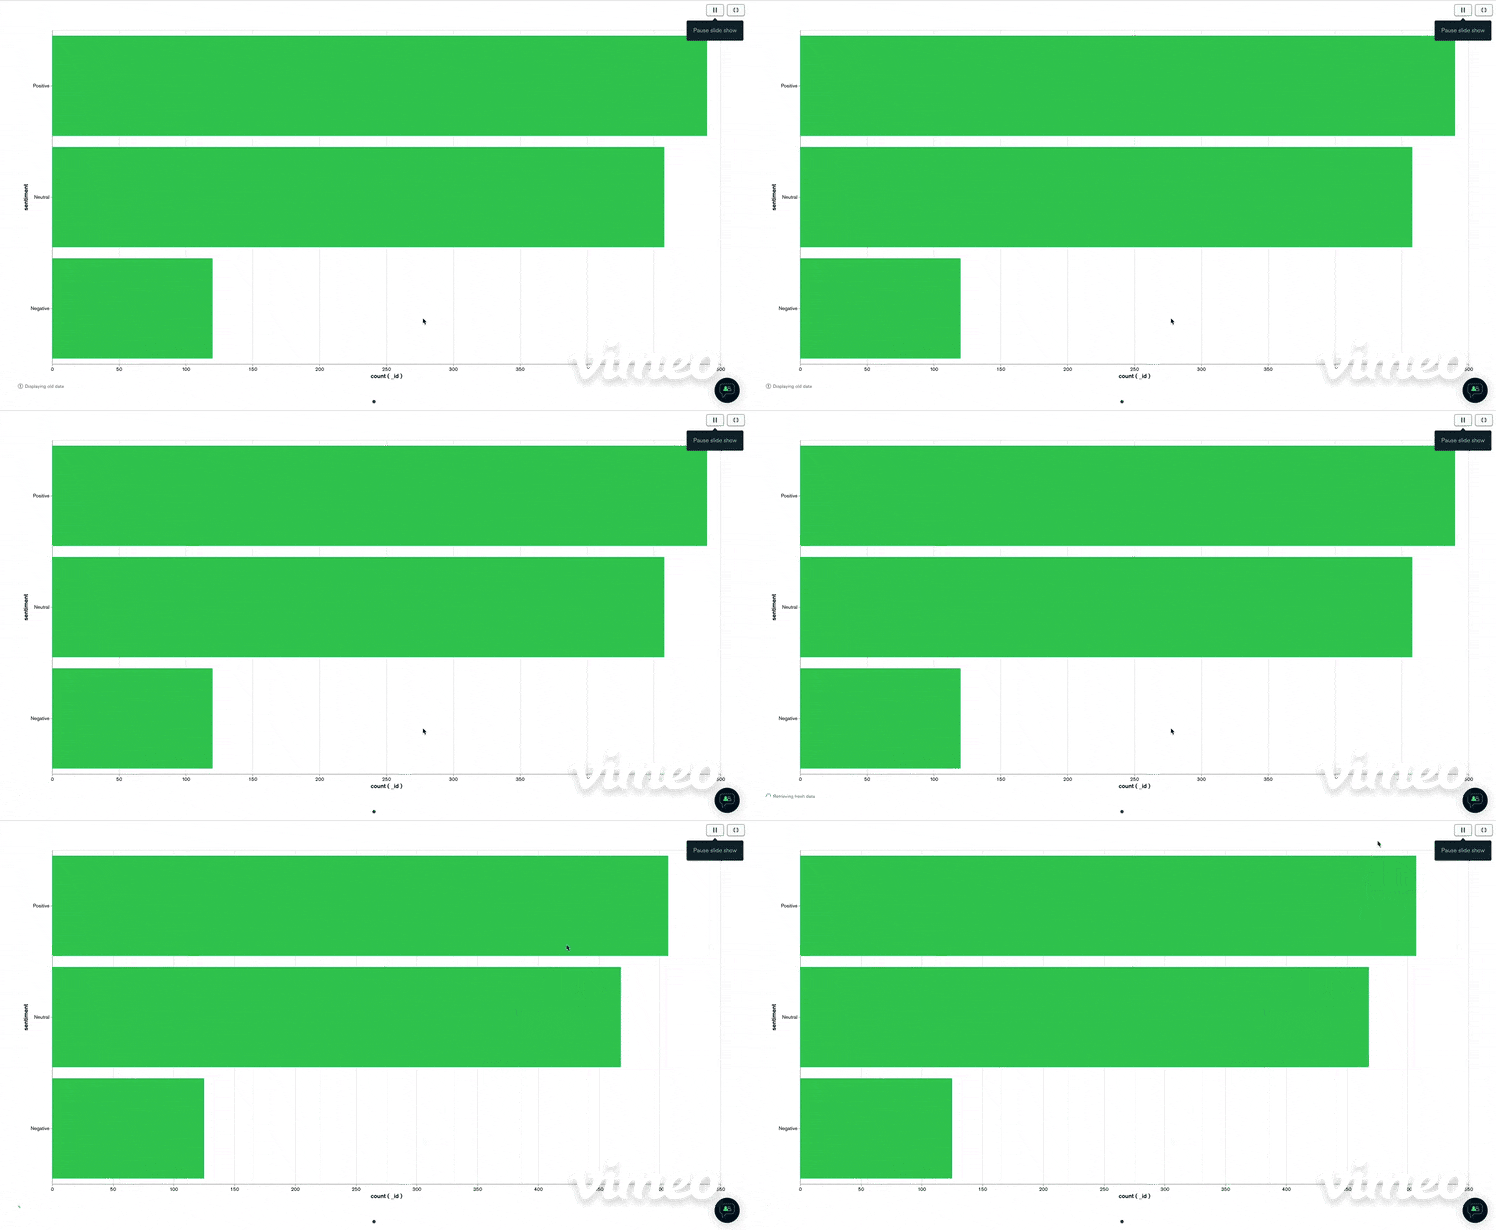
I then visualize them by clicking on "visualize your data" You get then a platform very clear and easy to manipulate and where you can drag and drop the information you want to visualize. I just do a simple visualization chart with the number of positive, negative or neutral tweets. We get a chart like this.

Conclusion
To conclude, MongoDB Atlas is a good tool for storing and doing charts in my opinion.
But, I noticed a problem with the refreshing time, as I'm doing real-time, MongoDB gave a range of time to refresh starting with 20 seconds. This means that the charts are not automatically upgrading while receiving the data; It has to wait 20 seconds.
I have maybe to test other visualisation tools to do the comparison in terms of latency.
